
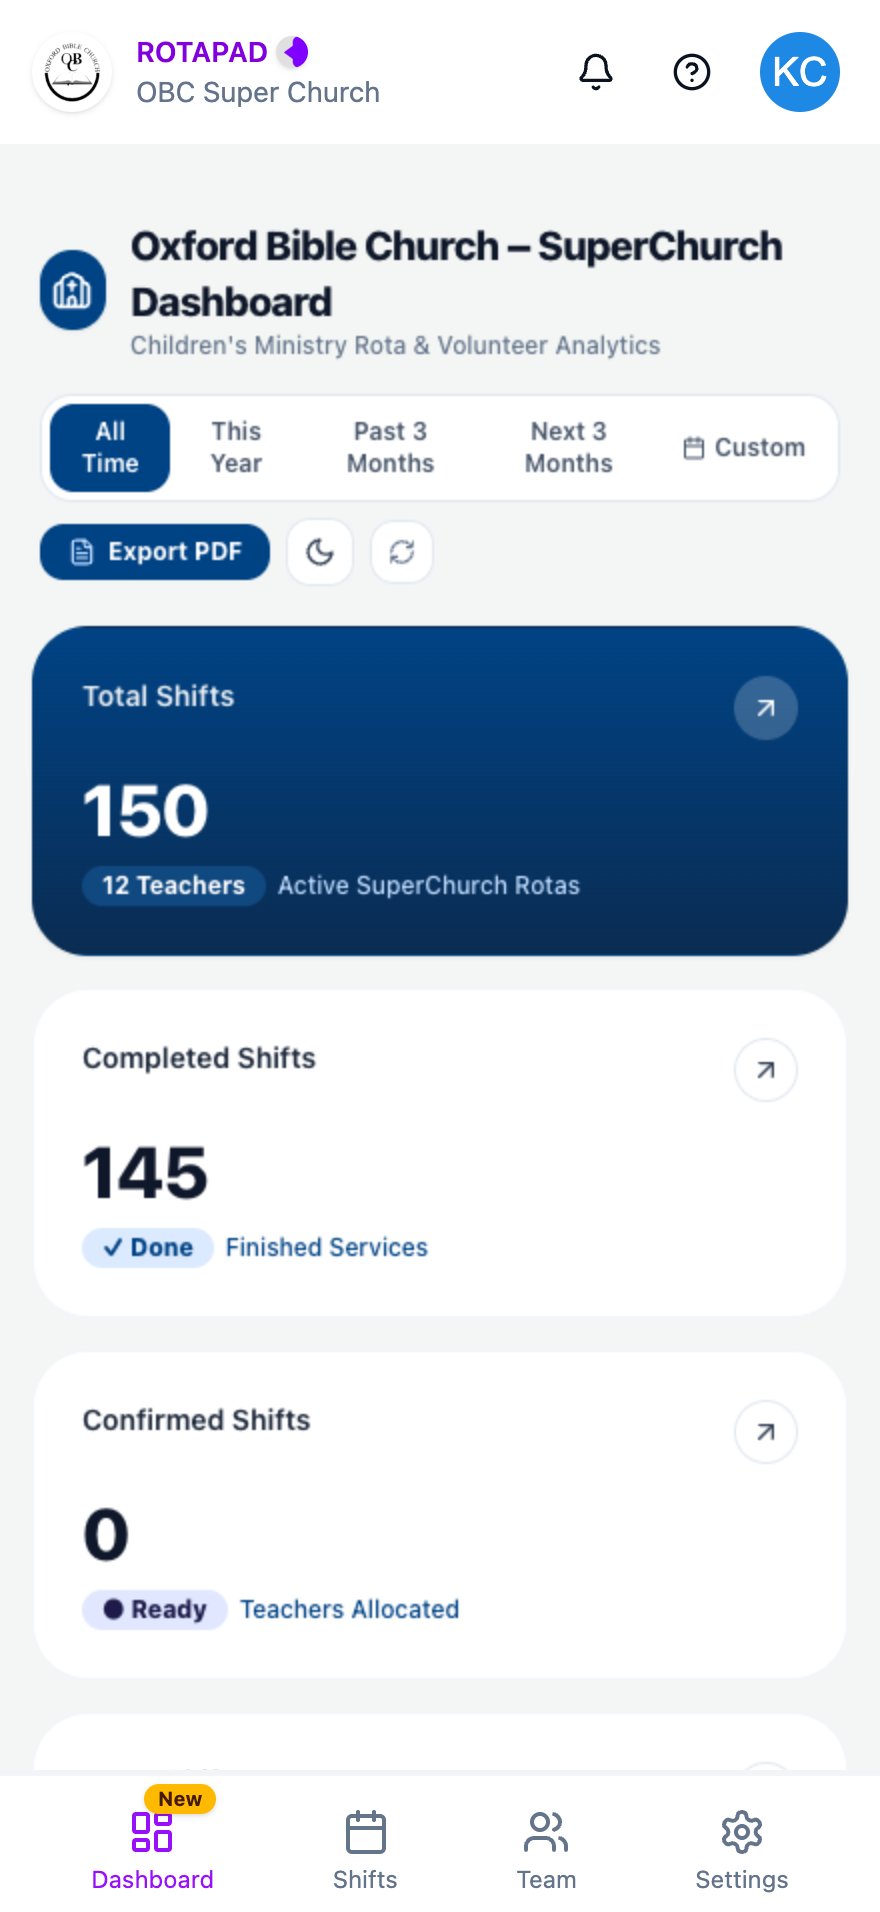
The Dashboard shows numbers and charts about the Children’s Church rota: how many shifts there are, how many are done, and how the team is sharing them. Everyone on the team can see it. Tap Dashboard in the bottom navigation bar to open it. Scroll down to see all of it.
Dashboard with time range buttons, Export PDF, and cards for Total Shifts and Completed Shifts

The top of the Dashboard

What it shows

The cards at the top give totals for the selected time range:
  • Total Shifts
  • Completed Shifts
  • Confirmed Shifts
  • To Do Shifts
Further down, the sections show shifts by month, overall progress, team statistics, Sunday availability and the service schedule.

Change the time range

Tap a time range at the top to update the numbers: All Time, This Year, Past 3 Months or Next 3 Months.

Other buttons

  • Export PDF: downloads a two-page report for the selected time range: the totals and charts, then a list of past services and who was on them. The button shows Generating PDF… while the report is made. On a phone, the file goes wherever your browser saves downloads.
  • Moon or sun icon: switches the dashboard between light and dark colours.
  • Circular arrows: reloads the latest numbers.

Common problems

The dashboard doesn’t load

If you see “Couldn’t load the analytics dashboard”, tap Open it in a new tab instead to open the dashboard on its own.

The numbers look out of date

Tap the circular arrows to reload the latest numbers.